Your pages load quickly, the hero image is sharp, yet Search Console flags “INP issue: longer than 200 ms” and visitors say the menu feels sticky on their phones. That is an Interaction to Next Paint problem, and no amount of image compression will fix it. This guide shows how to find the slow interaction on a WordPress site, which part of it is slow, and the theme and plugin changes that bring INP back under 200 ms. The same methods work on Joomla, and we cover that at the end.
What INP measures (and why your speed score can look fine)
Interaction to Next Paint is the Core Web Vital for responsiveness. It replaced First Input Delay (FID), which only looked at the delay before the first interaction on a page. INP watches every click, tap and key press during the whole visit and reports one of the slowest. Hovering, scrolling and zooming are not counted.
According to web.dev’s INP documentation, the thresholds are measured at the 75th percentile of real page loads, split by mobile and desktop:
INP value
Rating
200 ms or less
Good
Above 200 ms, up to 500 ms
Needs improvement
Above 500 ms
Poor
This is why a page can score well in a lab test and still fail INP. A Lighthouse run loads the page once and does not click anything. INP comes from real visitors on real phones, tapping the mobile menu toggle, the “Add to cart” button or an accordion while the browser is still busy running scripts.
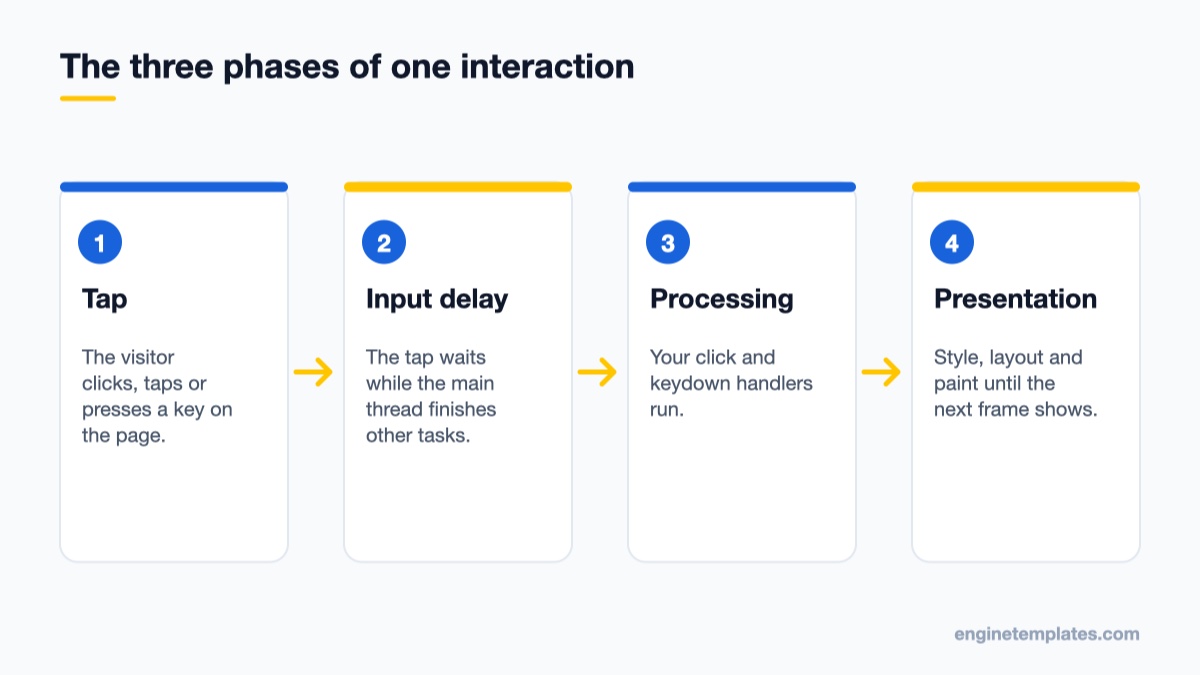
INP is the time from a tap or click until the next frame is painted, split into three phases.
Every interaction has three phases, and knowing which one is slow tells you what to fix:
Input delay – the time before your event handlers can even start, because the main thread is busy with something else (usually a long task from a script that is still loading or running).
Processing duration – the time your own click or keydown handlers take to run.
Presentation delay – the time from the end of the handlers until the browser paints the next frame, which grows with large DOM trees and expensive style or layout work.
Step 1: Find the pages and interactions that fail
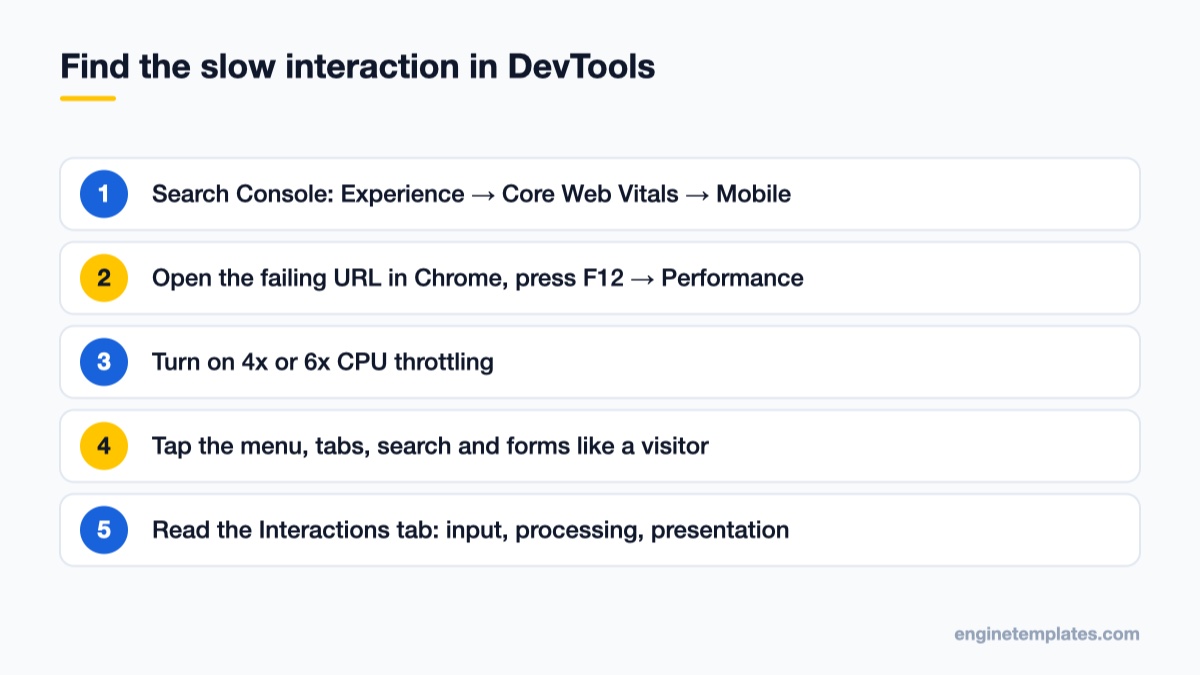
Start with field data, because that is what Google uses. In Google Search Console, open Experience → Core Web Vitals, choose the Mobile report and look for the “INP issue” rows. Search Console groups similar URLs, so you will usually see a pattern such as “all product pages” or “all blog posts” rather than one URL. That pattern already hints at the cause: if only product pages fail, look at the product gallery or the variation picker; if every page fails, look at something site-wide such as the header, a chat widget or a cookie banner.
Next, run one URL from each group through PageSpeed Insights. The top section, “Discover what your real users are experiencing”, shows the INP value from the Chrome UX Report when the URL or origin has enough traffic. The Lighthouse section below cannot measure INP because it does not interact with the page; its Total Blocking Time is the closest lab hint, since heavy blocking time usually means long input delays. If you need a refresher on which test tool shows what, our roundup of website speed test tools covers the main options.
Field data tells you which pages are slow, not which button. For that you need to reproduce it yourself.
Step 2: Reproduce the slow interaction in Chrome DevTools
The Performance panel's live metrics record INP while you use the page.
Record your local INP
Open the failing page in Chrome, press F12 and select the Performance panel. Local LCP and CLS appear right away.
Turn on CPU throttling (4x or 6x slowdown) in the panel’s capture settings. Your laptop is far faster than a mid-range phone, and an interaction that takes 80 ms on your machine can take 400 ms on a visitor’s device.
Interact with the page the way visitors do: open the mobile menu, tap tabs and accordions, open the search box, change a product variation, type in a form field.
Watch the INP card update and open the Interactions tab under the metric cards. Each entry lists the element, the total time and the breakdown into input delay, processing duration and presentation delay.
Optionally go to Next steps → Field data, click Set up and confirm, so the panel compares your local numbers with real-user data from the Chrome UX Report.
Once you have found the slow interaction, click record, repeat that one interaction, and stop. In the trace, look for the interaction in the Interactions track and the long tasks (marked with red corners) on the Main track around it. Expand the task and the bottom-up view shows which script file and function used the time. On WordPress, the file path usually gives away the source: /wp-content/plugins/plugin-name/ or /wp-content/themes/your-theme/.
Step 3: Fix long input delay (scripts blocking the main thread)
High input delay is the most common INP pattern on WordPress sites. The visitor taps the menu while the browser is still parsing and running a pile of JavaScript from the theme, a page builder, sliders, analytics, ad tags and chat widgets. The tap waits in line.
Load theme and plugin scripts with defer
Since WordPress 6.3, wp_enqueue_script() accepts an $args array with a strategy key (defer or async) and an in_footer key, as described in the wp_enqueue_script() reference. If you maintain a child theme, enqueue your own scripts like this:
WordPress checks the dependency tree, so it may fall back to a less strict loading strategy if a dependent script needs it, but it never makes loading stricter than you asked. Deferred scripts still run before the page is fully interactive, so defer helps most when combined with doing less work, not instead of it.
Remove or delay what visitors do not need
Audit plugins page by page. A slider script loaded on every page but used only on the home page is pure input delay on the other pages. Many plugins have a setting to load assets only where their shortcode or block is used; turn it on.
Delay third-party tags. Chat widgets, heatmaps and social embeds do not need to run before the first tap. Most caching and optimization plugins offer a “delay JavaScript” option that waits for the first user interaction. Test carefully afterwards, because delaying a script that builds the menu will break the menu. Our comparison of LiteSpeed Cache and WP Rocket covers the optimization options in both.
Trim page builder add-ons. Each Elementor add-on pack brings its own scripts. Disable widgets you do not use in the add-on’s settings, and see our guide on speeding up a slow Elementor site for builder-specific cleanup.
Step 4: Fix long processing duration (your own handlers)
If the Interactions tab shows most of the time in processing duration, the code that runs on click is doing too much in one go. Typical culprits on themes are menu scripts that measure every submenu on open, filters that rebuild a whole product grid, and handlers that send analytics events synchronously before updating the screen.
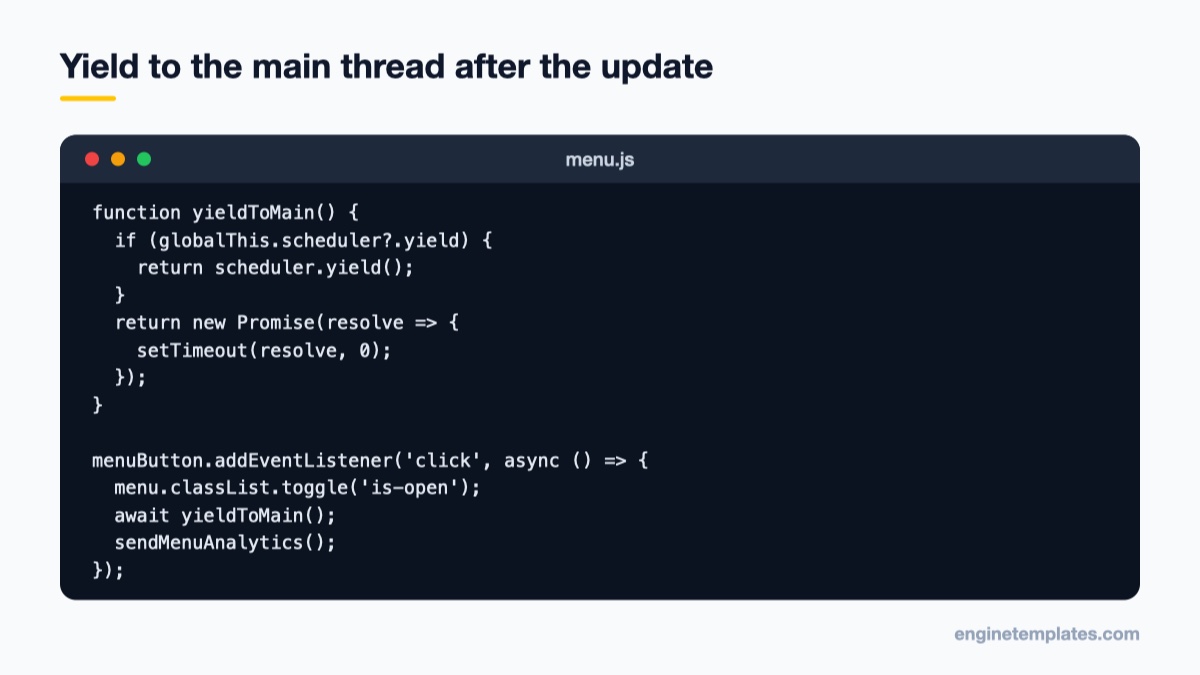
The fix is to do the visible update first, then hand the rest of the work back to the browser so it can paint. Google’s guide to optimizing long tasks recommends a small helper that uses scheduler.yield() where the browser supports it and falls back to setTimeout elsewhere:
Toggle the menu first, then let the browser paint before running the rest.
function yieldToMain() {
  if (globalThis.scheduler?.yield) {
    return scheduler.yield();
  }
  return new Promise(resolve => {
    setTimeout(resolve, 0);
  });
}

menuButton.addEventListener('click', async () => {
  menu.classList.toggle('is-open');
  await yieldToMain();
  sendMenuAnalytics();
});
The class toggle runs immediately, the browser gets a chance to paint the open menu, and the analytics call runs in a new task afterwards. web.dev notes that scheduler.yield() is supported in Chromium-based browsers from version 129 and in recent Firefox, but not in Safari, which is why the fallback matters.
A few more rules for handlers:
A task longer than 50 ms counts as a long task. If a loop processes many items, yield every 50 ms or so rather than after every item, because each yield has a small cost.
Avoid reading layout values (offsetHeight, getBoundingClientRect()) right after changing styles inside a loop. That forces the browser to recalculate layout again and again.
For search-as-you-type fields, debounce the input handler so the filter runs after the visitor pauses, not on every keystroke.
Step 5: Fix long presentation delay (DOM size and rendering)
When the handlers finish fast but the next frame still takes a long time, the browser is struggling to recalculate styles, layout and paint. That usually comes down to page weight in the DOM, not in kilobytes.
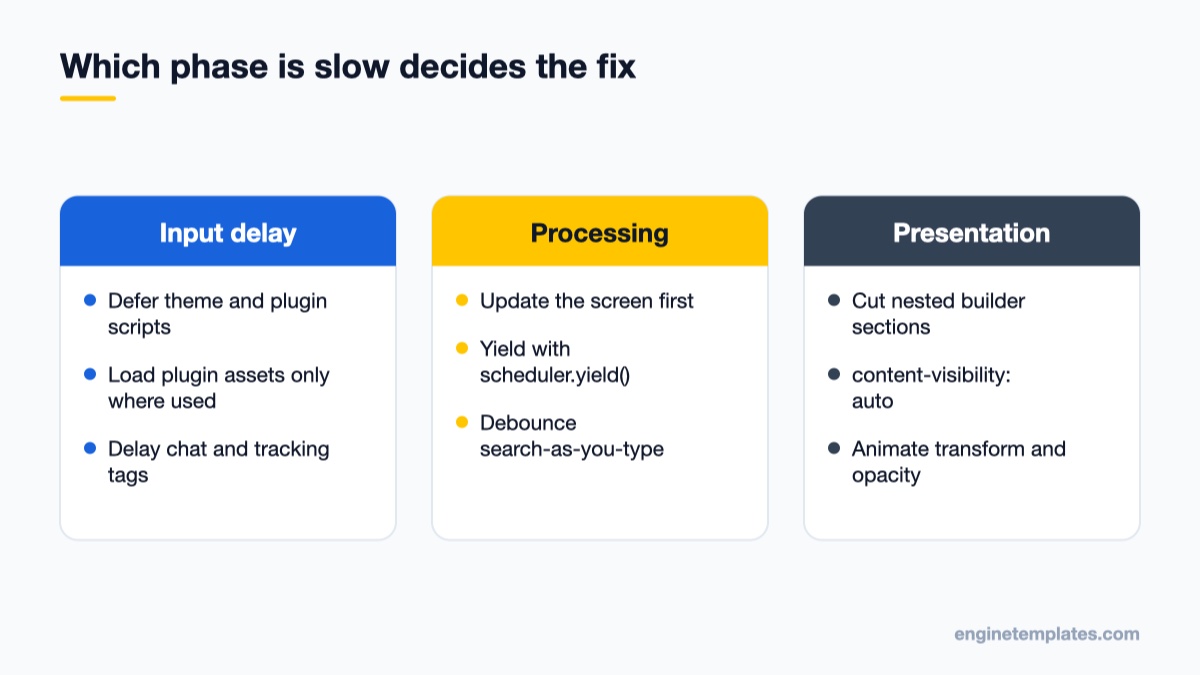
Match the largest phase in the Interactions breakdown to the right kind of fix.
Reduce DOM size. Page builders wrap every element in several containers. Rebuilding a long landing page with fewer nested sections, using native blocks for simple content, and removing hidden duplicate mobile and desktop sections all reduce the work per interaction.
Use content-visibility: auto on long sections below the fold. The browser can skip rendering work for off-screen sections. Give those sections a contain-intrinsic-size so the scrollbar does not jump.
Do not render big hidden menus on every page. A mega menu with hundreds of links costs rendering time on every tap. Keep it lean, or build its contents when it is first opened.
Prefer CSS transitions over JavaScript animation for opening menus and accordions, and animate transform and opacity rather than height or top.
Theme choice matters here too. A lightweight one-page theme with modest markup gives you far more headroom than a heavy multipurpose theme stacked with add-ons. ET Wevo Onepage is a free one-page WordPress theme suited to agencies and freelancers, and ET Fixman Onepage is a free landing-page theme for local service businesses; both keep the page to a single focused layout, which makes it easier to keep DOM size and script count in check.
INP on Joomla: the same causes, different switches
Joomla sites fail INP for the same reasons: too many scripts competing for the main thread, slow handlers in template or extension JavaScript, and large DOM trees from heavy page builders. The diagnosis in Steps 1 and 2 is identical, since Search Console and DevTools do not care which CMS built the page.
For loading, Joomla 4, 5 and 6 use the Web Asset Manager. You can add a defer attribute to a script asset in your template’s joomla.asset.json, as shown in the Joomla Web Asset Manager manual:
Or in PHP, pass the attributes array when registering the script: $wa->registerAndUseScript('template.mytemplate.menu', 'menu.js', [], ['defer' => true], ['core']);. The yieldToMain() pattern from Step 4 works unchanged in Joomla template JavaScript, and the DOM advice in Step 5 applies to every template.
Common mistakes
Testing only on a fast desktop. Always throttle the CPU. INP failures are mostly mobile failures.
Expecting instant results in Search Console. Field data is collected over a rolling 28-day window, so a fix takes weeks to show fully. Use the “Validate fix” button on the issue and keep checking DevTools in the meantime.
Delaying every script blindly. If the menu, cart or form needs a script to work, delaying it until the first interaction makes that first interaction slow, or broken. Exclude interactive scripts from delay rules.
Stale optimized files. After changing script settings, clear the plugin cache, any server cache and the CDN, or you will be testing the old build. Our guide to clearing every WordPress cache layer walks through each one.
Chasing the lab score. A Lighthouse score of 100 does not mean good INP. Judge the fix by the Interactions tab under throttling and, later, by field data.
Wrap-up: your INP checklist
Find the failing URL groups in Search Console, reproduce the slow tap in the DevTools Performance panel with CPU throttling, and read the breakdown. Long input delay means too much JavaScript at the wrong time: defer, remove or delay it. Long processing means a heavy handler: update the screen first and yield. Long presentation delay means a heavy page: cut DOM size and rendering work. Fix one interaction at a time, re-test, then move to the next.
If you are starting a new site and want a lean base to build on, browse our free WordPress themes.
We're a Digital Team from EngineTemplate with 5 content experts. Our team has 5 years exp in open source Joomla and WordPress, we make daily blogs and build useful resources for everyone who is having issues with open source while using it.
 ET Digital Team