A slow WordPress or Joomla site is one of the most common support requests we see, and “just install a caching plugin” only helps if you actually know what’s slow in the first place. The tools below are how you find out — each one loads your page in a controlled environment, measures exactly where the time goes, and tells you specifically what to fix rather than just confirming that something, somewhere, is slow.
These aren’t ranked by importance, since the right tool depends on what you’re actually trying to do — a quick one-off check before a client call needs something different than an agency monitoring dozens of sites continuously for regressions. Each entry links directly to the real tool and shows an actual screenshot from that tool’s own site, so you know what you’re getting before you open a new tab.
Free, Instant Checks
Free instant website speed test tools category
These three are the right starting point for almost any speed question — no signup required, results in under a minute.
The tool most people mean when they say “check my PageSpeed score,” and for good reason — it’s built by Google, runs on the same Lighthouse engine that powers most other tools on this list, and reports both lab data (a simulated test) and real field data pulled from actual Chrome users who’ve visited your site (via the Chrome User Experience Report). That field data matters specifically because it’s the same Core Web Vitals data Google’s own ranking systems use, so this is the one tool on this list where the score has a direct, documented connection to search ranking. The tradeoff for that authority is a fairly generic report — for deeper diagnostic detail on exactly why a specific request is slow, you’ll often end up cross-checking with GTmetrix or WebPageTest anyway.
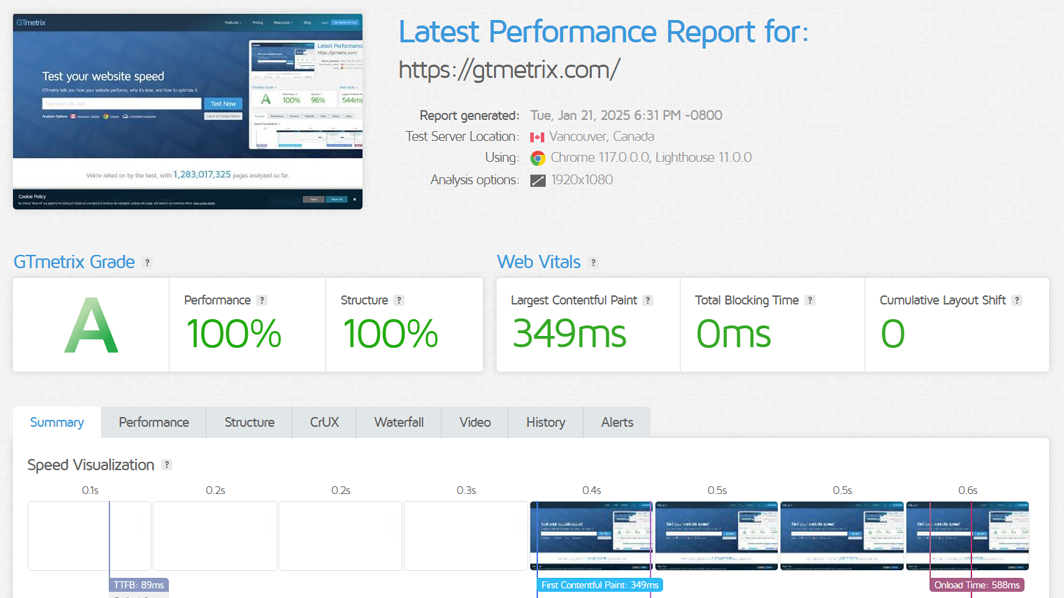
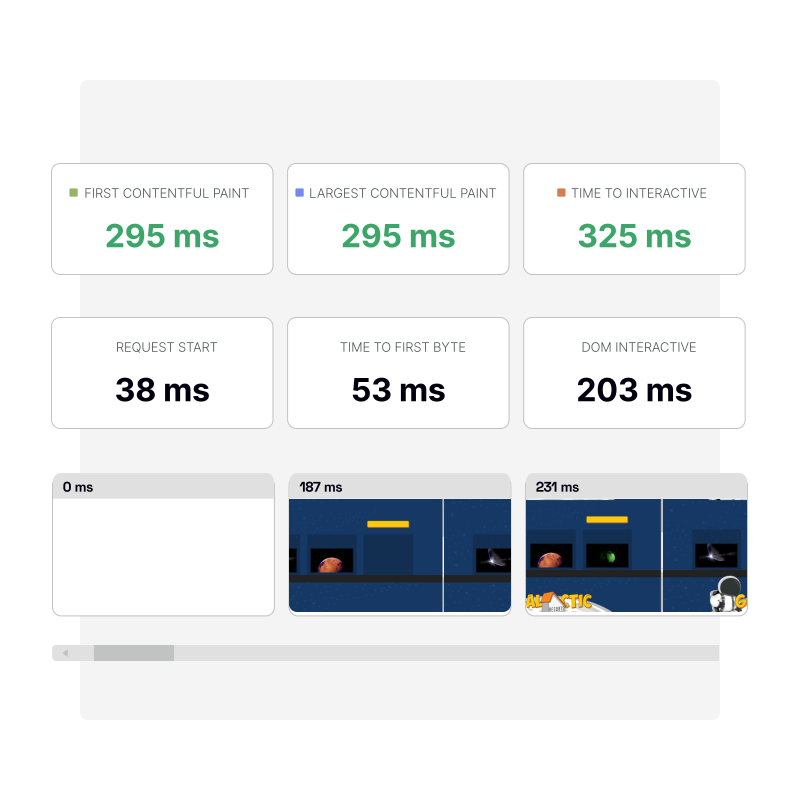
A free tool combining Lighthouse scoring with a genuinely readable summarized report, a full request waterfall chart, and a video/filmstrip view showing your page rendering frame by frame. GTmetrix has been around since well before Core Web Vitals existed and remains a common first stop specifically because the free tier is generous — no account needed for a basic test, though creating one unlocks additional test locations and historical tracking. It’s a reasonable middle ground between PageSpeed Insights’ simplicity and WebPageTest’s depth.
Originally created by Patrick Meenan in 2008 and now part of Catchpoint, WebPageTest remains the deepest free diagnostic tool available, widely considered the gold standard specifically for understanding why a page is slow rather than just confirming that it is. It supports testing from real browsers across dozens of global locations, genuinely granular network throttling (simulating 3G, 4G, or custom packet loss), and a detailed waterfall view that’s the reference point most other tools’ waterfall charts are modeled after. The interface is more technical than GTmetrix or PageSpeed Insights, which is the tradeoff for the additional depth — worth reaching for specifically when a simpler tool’s report doesn’t explain enough.
Ongoing Monitoring
Website performance monitoring tools category
A one-off test tells you about right now. If you’re managing a site (or several) over time, a monitoring tool that tracks performance continuously and alerts you to regressions is a meaningfully different — and often more valuable — kind of tool.
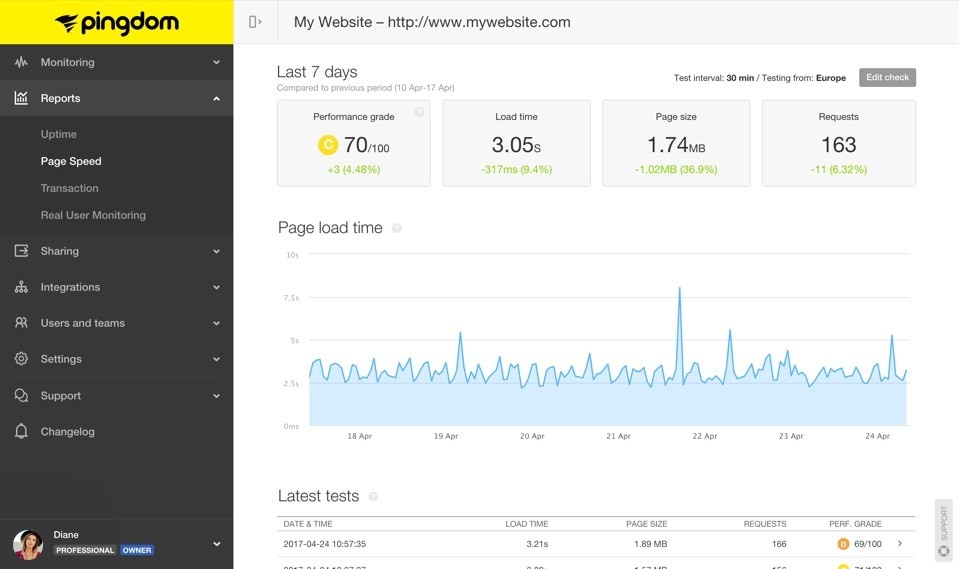
Now part of SolarWinds, Pingdom’s free speed test is built around simplicity — enter a URL, get a clean report with a content-size breakdown by type (images, scripts, CSS, HTML) and response codes flagged directly in the results, so a broken asset silently dragging down your load time doesn’t stay hidden. Historical result tracking is included even on casual use, which makes it easy to check whether a specific code change or plugin update actually helped. Pingdom’s own paid monitoring product extends this into continuous, scheduled testing with alerting if you need something running in the background rather than checked manually.
A free test built on the same Lighthouse foundation as PageSpeed Insights, with Uptrends’ own reporting layered on top — a request waterfall, Core Web Vitals, and a filmstrip view, testable from up to 10 free global locations (229 with a paid account) using current Chrome or Edge browser versions specifically, rather than the older browser builds some competing free tools still run tests on. Worth a look specifically if your visitors are meaningfully international, since testing from a location close to your actual audience gives a more representative result than testing only from wherever the tool’s default location happens to be.
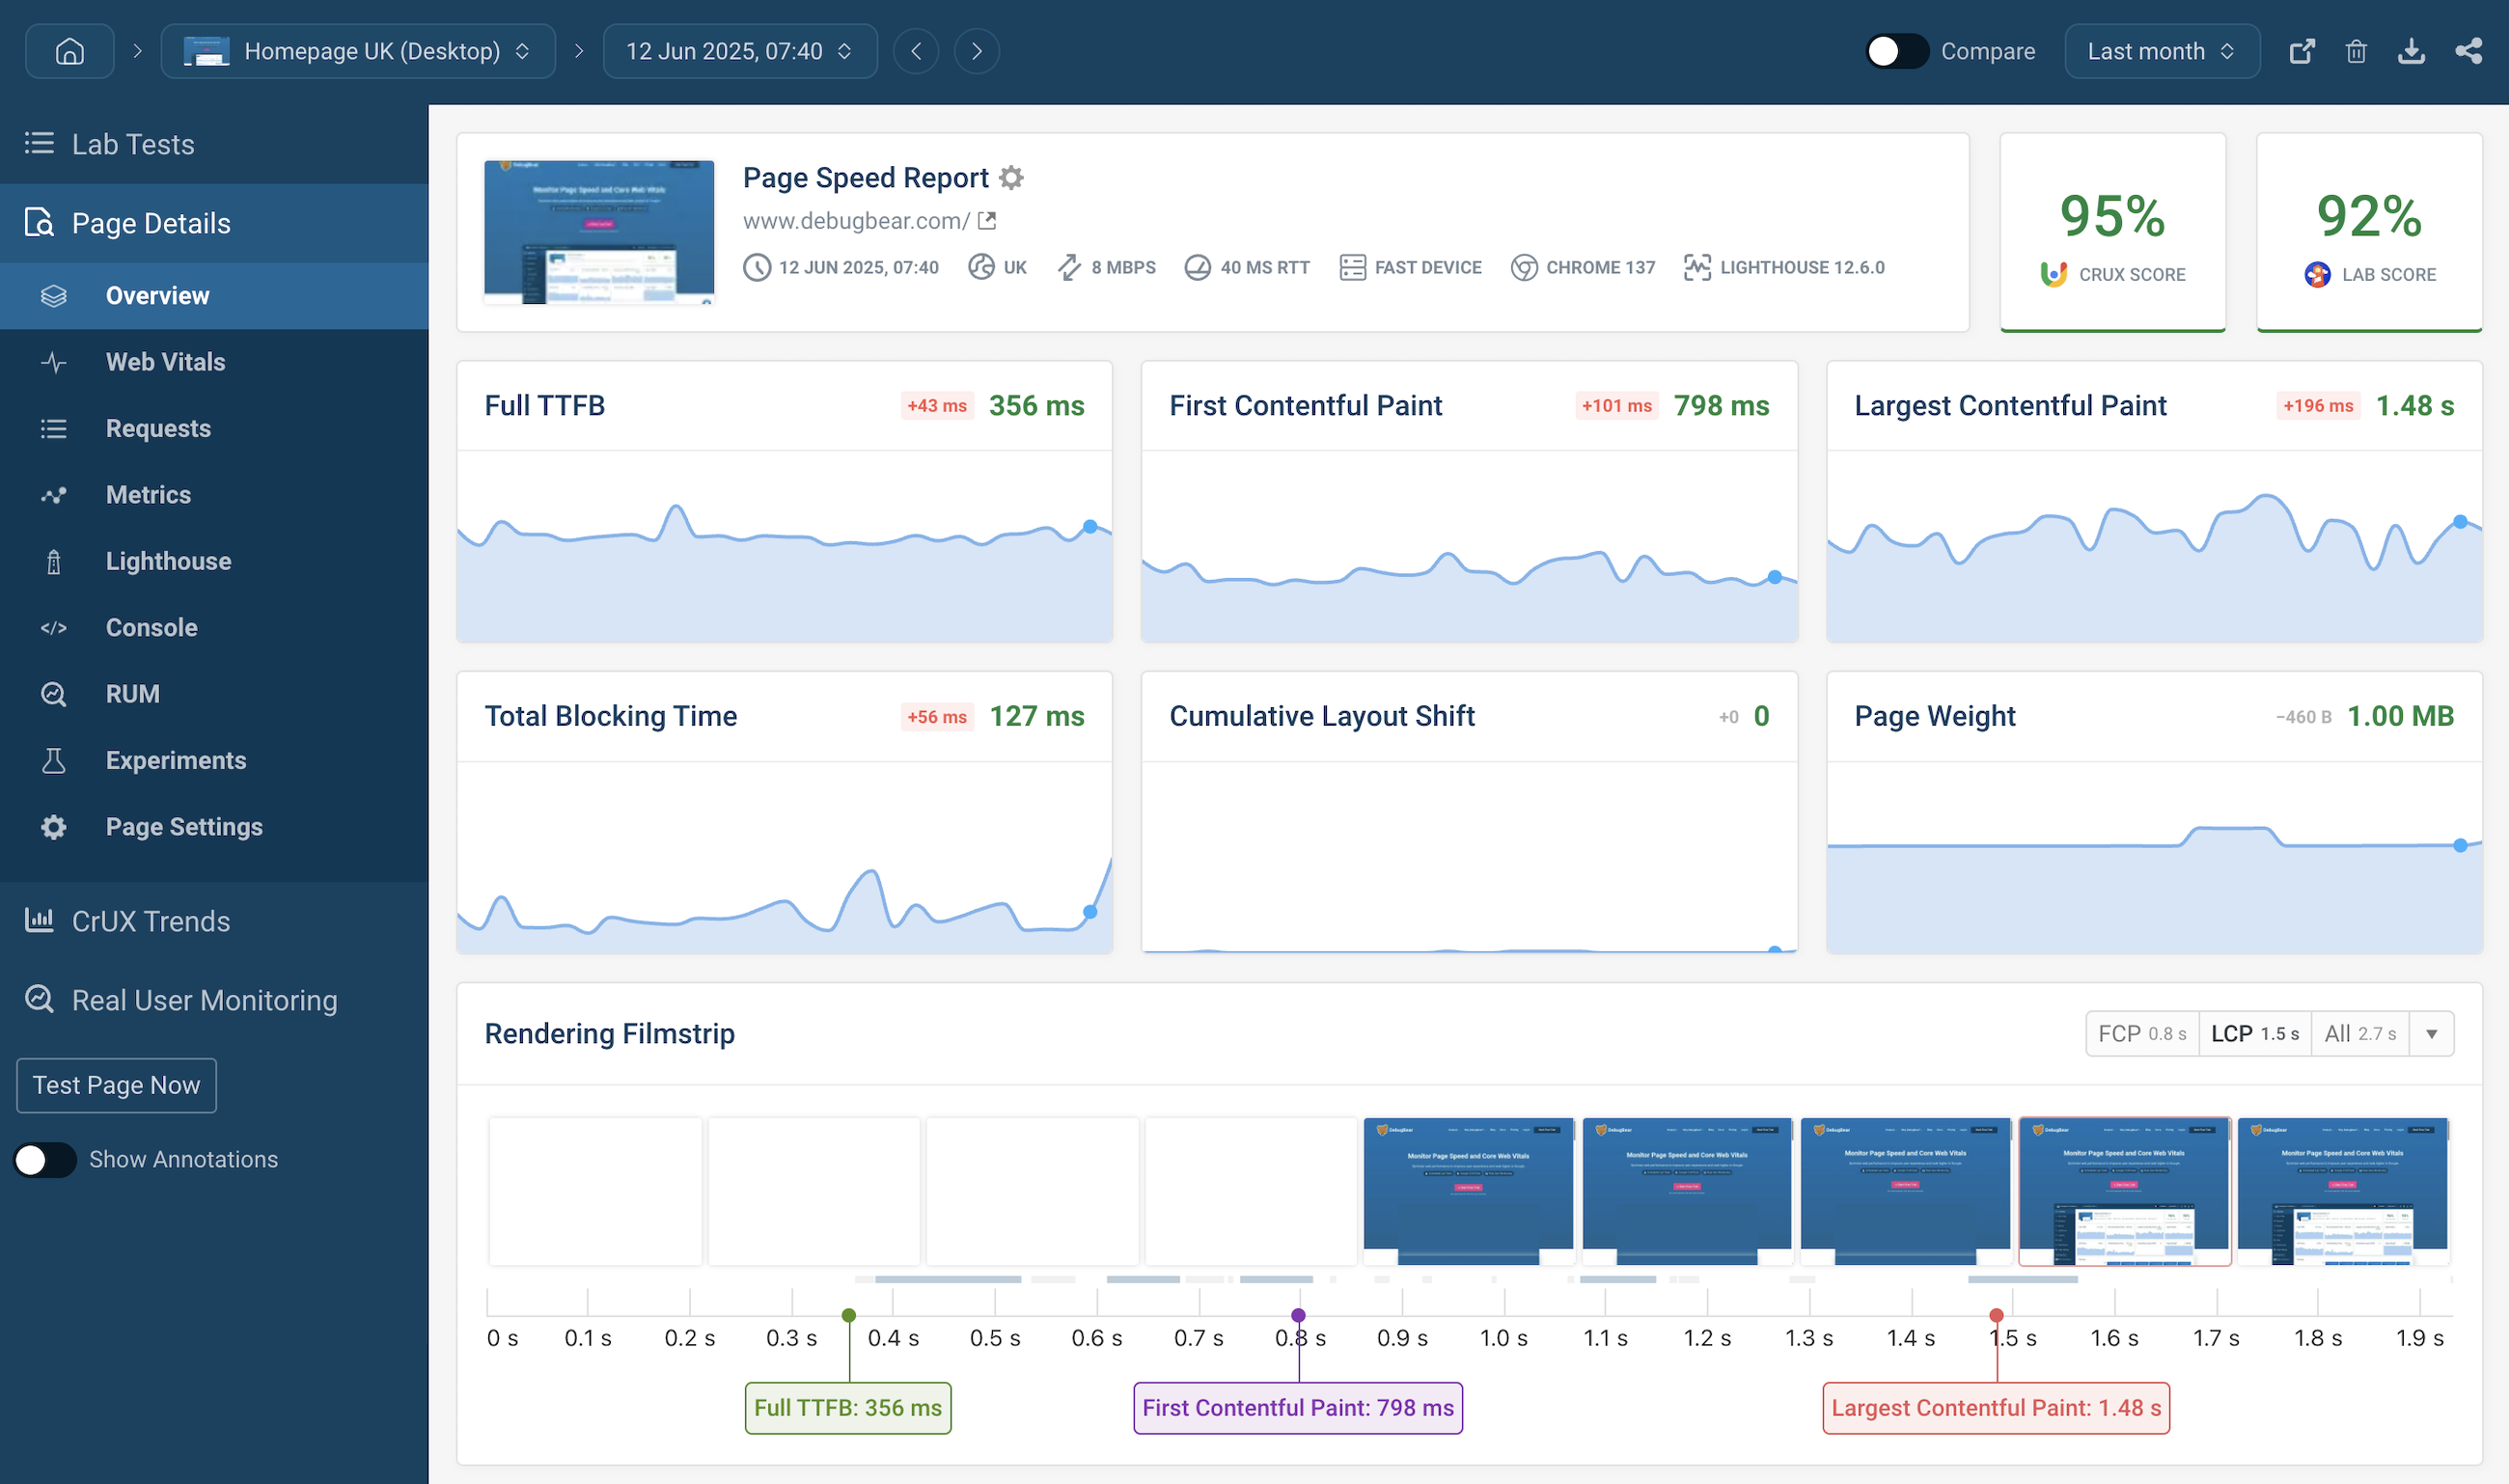
A paid-first tool (with a free trial) built specifically around continuous Core Web Vitals monitoring rather than one-off checks — scheduled synthetic tests, real user monitoring pulling from actual visitor data, and an in-depth before-and-after comparison view that shows exactly what changed between two points in time when your site’s performance shifts. DebugBear’s request waterfall and regression alerts are aimed at teams and agencies managing performance as an ongoing responsibility rather than a periodic check, which is the right framing if performance directly affects revenue or client relationships for you specifically.
A free, open-source tool with a different focus than the others on this list — rather than emphasizing load-time metrics, it audits your page’s actual front-end code quality: DOM complexity, JavaScript execution cost, CSS complexity, font loading behavior, and roughly fifty other specific best-practice checks. It’s a genuinely useful complement to a Lighthouse-based tool specifically when you already know a page is slow and need to understand which part of your actual code is responsible, rather than just another confirmation that the page is, in fact, slow.
Choosing the Right Tool for the Job
You don’t need to run all seven on every test. A practical way to match tool to task:
Quick check before a client call or after a plugin update — PageSpeed Insights or GTmetrix, both fast enough to run while someone’s on hold.
Genuinely stuck on why a specific page is slow — WebPageTest’s waterfall and filmstrip view, or Yellow Lab Tools if the issue seems to be in your actual code rather than network or server timing.
Managing performance across a portfolio of client sites over time — Pingdom, Uptrends, or DebugBear, depending on how much continuous monitoring and alerting you actually need versus periodic manual checks.
Confirming a fix actually worked — whichever tool you used to diagnose the original problem, run again after the fix, so you’re comparing like-for-like rather than switching tools and getting a different baseline.
One genuinely common mistake worth avoiding: testing once, making a change, and testing again immediately without accounting for caching. A CDN or caching plugin can make a “before and after” comparison look far more dramatic than the change actually was, simply because the “after” test benefited from a warm cache the “before” test didn’t have. Clear your cache — or wait for the natural cache cycle — before treating a re-test as a fair comparison.
If your site’s performance issue turns out to be file permissions, PHP errors, or a scheduling problem rather than something a speed test alone can diagnose, our other troubleshooting guides cover those specifically — a speed test tells you that something is slow, not always why at the server level.
Tool features and pricing change over time — always check the current site before relying on a specific plan or feature.
We're a Digital Team from EngineTemplate with 5 content experts. Our team has 5 years exp in open source Joomla and WordPress, we make daily blogs and build useful resources for everyone who is having issues with open source while using it.
 ET Digital Team