Hikashop enables you to generate reports based on your shop data. Through graphs, tables, pies and many other charts you will be able to visualize your shop information such as the number of sales this month, the best product sold this year,….
Reports are available in both the Essential and the Business edition of HikaShop.
The first thing you need to do is to click on the menu Components >> HikaShop and then on the HikaShop menu Orders >> Reports in your back end.
Toolbar
Export : Click on this button, you can download a CSV file of the statistics for further processing via Microsoft Excel and other tools handling this common data format. It’s only available with HikaShop Business.
Save & Close : Click this button to save the report and return to the reports management screen.
Save : Apply the modifications to the report and stay on the same screen.
Cancel : Click on this button if you want to return to the previous screen without saving the modifications.
Help : This button enables you to turn ON/OFF the help section.
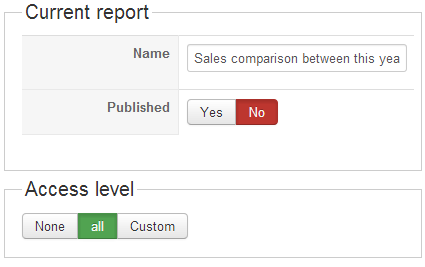
Set the main information: Current report
Name : Define the name of your report here.
Published : When your report is published, it is displayed on the dashboard.
Access level: You can restrict the report from being displayed to some joomla groups of users.
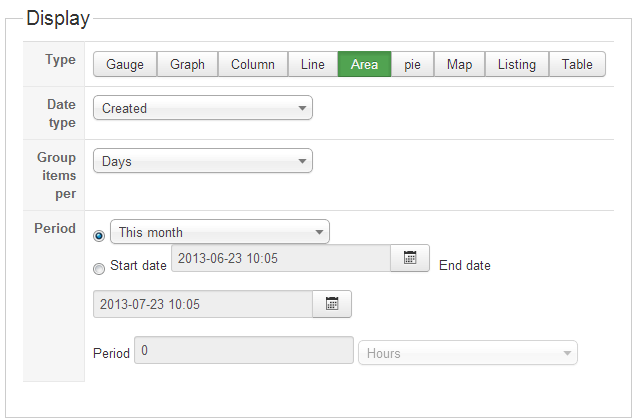
Choose your kind of report: Display
Display Type : Define the display type of report which will be generated.
Date Type: Choose the date type used to generate the report.
Group items per: This option gives a more readable report by allowing you to group your items per days, months, year or hours. So if you want to see you sales for the last year you can choose to group them by month in order to get a chart with 12 points or columns.
Period: Define the period on which the report is based. It can be a predefined period (this year, this week…) or define a specific period.
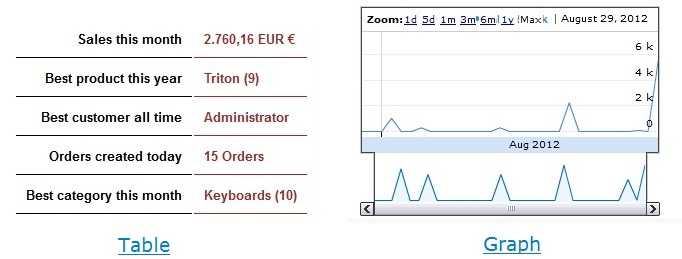
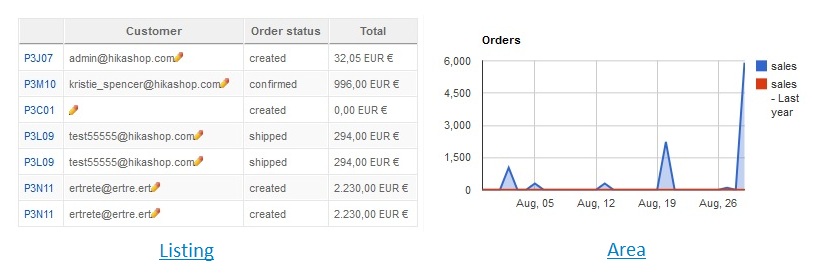
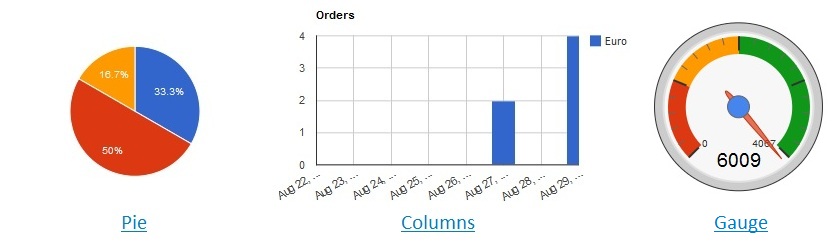
Here are the different display which are available:
Data Type: What do you want to visualize?
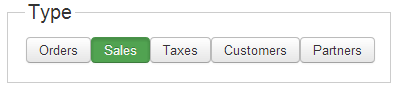
Type: In this section you have to define the type of data on which your report will be based.
Orders: The number of orders
Sales: The amount generated by your orders
Taxes: The amount of tax paid on your orders
Customers: Your customers
Partners: Your partners
(for those last two types you can choose among multiple sources of data)
Display options: Filters and compares
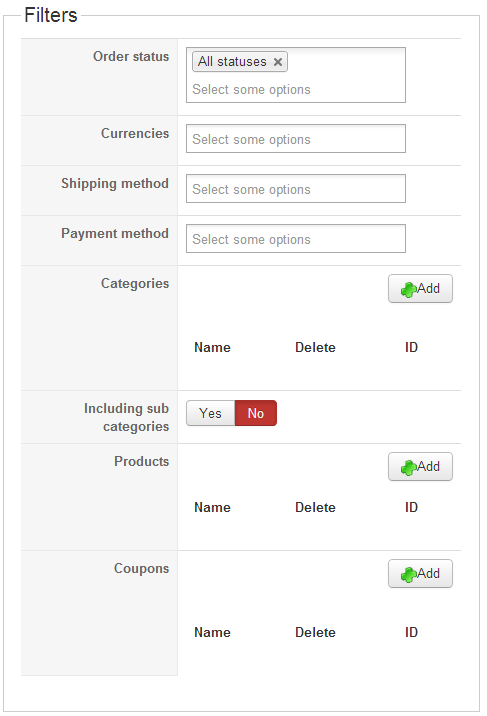
Filters and compares allow you to generate a report on a specific category as well as for a specific currency or compare the sales for your 5 best products. The filter section will for example filter the data in order to use only specific elements for the chart.
Order Status : Choose here the order status of the visualized orders. Indeed, you can display only the shipped or created orders as well as the confirmed orders only.
Currency : Display the orders paid with the selected currencies.
Shipping method : Display the orders using the selected shipping methods.
Payment method : Display the orders using the selected payment methods.
Categories : Display the orders with products in the selected categories.
Include sub categories : Include or not the sub categories of categories selected above.
Products : Display the orders including one or more selected products.
Coupons : Display the orders including one or more selected coupons.
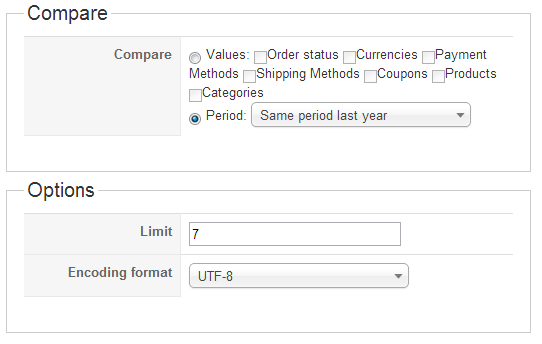
The compare section allows you to generate compared reports. You can generate a report showing the sales of this year and the sales of last year, to compare the evolution of your shop.
Compare : Choose to compare your data either on a period or on a value base. Values will allows to compare orders and sales dividing them on the selected criterias. These options are cumulative so you can see the evolution of your products’ sales depending on the payment method. The period option will make a comparison between the sales of the chosen period and the sales made on the last same period or on the same period last year.
Limit: This option defines a limit to the number of lines / columns displayed. If you have so many products and chose the product compare option, the report will be unreadable so you can set this option and it will only display the best products.
Encoding format: Define the format of the exported csv.
If you have any question about this post, don’t hesitate to leave a comment below. And don’t forget to share with your friends if you find it useful! Thanks!
We're a Digital Team from EngineTemplate with 5 content experts. Our team has 5 years exp in open source Joomla and WordPress, we make daily blogs and build useful resources for everyone who is having issues with open source while using it.