“There has been a critical error on this website.” That’s the entire message WordPress shows when something breaks — no file name, no line number, nothing to actually act on. Joomla’s equivalent moments aren’t much better: a blank white screen, or a generic message that tells you something failed without saying what. In both cases, the actual answer is sitting in a file almost nobody looks at: the PHP error log.
This gap between “the error message” and “the actual answer” is one of the more frustrating parts of running a self-hosted CMS for anyone without a development background — the visitor-facing error deliberately hides the useful detail, for legitimate security reasons, but that same design choice leaves the actual site owner just as in the dark as a random visitor would be, unless they know where to look.
Reading it properly turns “something is broken and I have no idea why” into “line 42 of this specific plugin file is calling a function that doesn’t exist” — a fixable, specific problem instead of a guessing game. Here’s how to actually find your log, read what it’s telling you, and use it to stop guessing.
Why This Skill Matters Beyond Just Emergencies
It’s worth reframing error logs as more than a last-resort emergency tool. A healthy habit of periodically glancing at your log — even when nothing appears broken — surfaces problems while they’re still small: a plugin quietly logging repeated warnings that haven’t caused a visible failure yet, a deprecated function call that will stop working entirely on your next PHP version upgrade, or a pattern of errors tied to a specific page template that only some visitors happen to trigger.
Catching these early is meaningfully less stressful than discovering them during an actual outage, when you’re troubleshooting under time pressure with visitors actively unable to use your site. A brief weekly or monthly check — even just confirming the log isn’t accumulating new fatal-level entries — is a reasonable maintenance habit for any site owner who wants to stay ahead of problems rather than only reacting to them once they’ve already become visible outages.
What the Error Log Actually Is
What a PHP error log actually contains
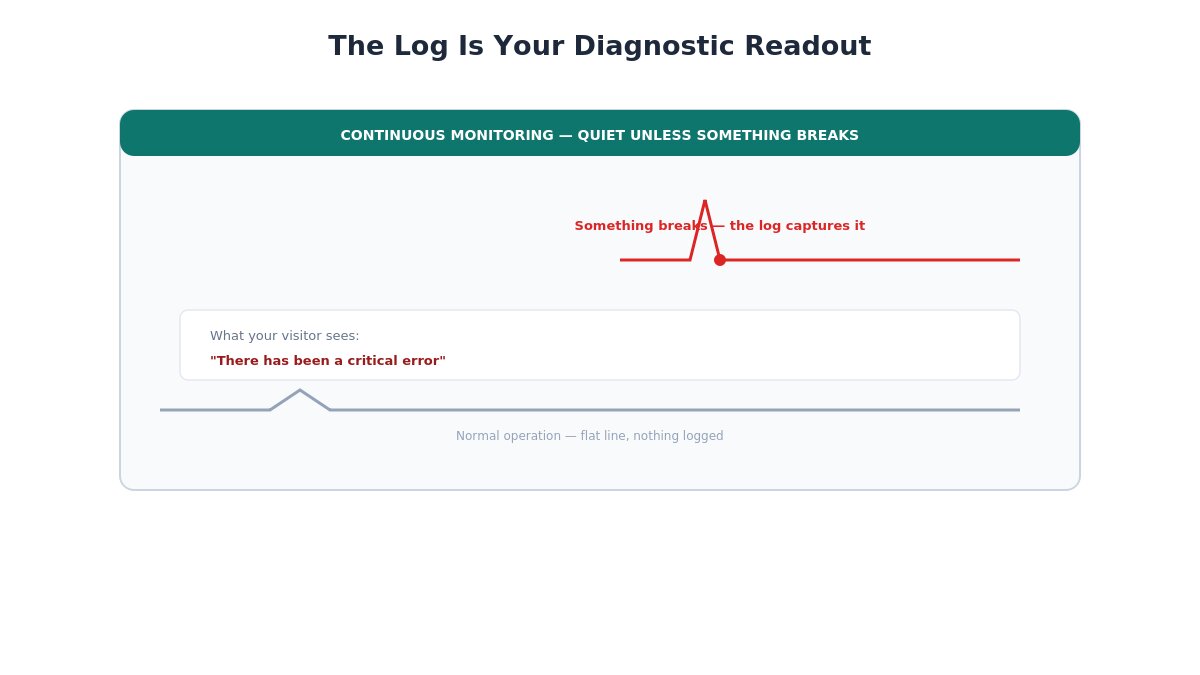
Every time PHP — the language WordPress and Joomla are both built on — encounters a problem while running your site, it can record that event to a log file, complete with what went wrong, which file it happened in, and the exact line number. Think of it as a continuous diagnostic readout running in the background of your site: most of the time nothing unusual happens and the log stays quiet, but the moment something breaks, the log captures the details your visitor-facing error page deliberately doesn’t show (partly for security — showing full file paths and code details to random visitors is a bad idea).
The log doesn’t fix anything on its own. What it does is turn an invisible problem into a specific, readable one, which is the actual first step in fixing it.
Anatomy of a Log Entry
The anatomy of a PHP error log entry
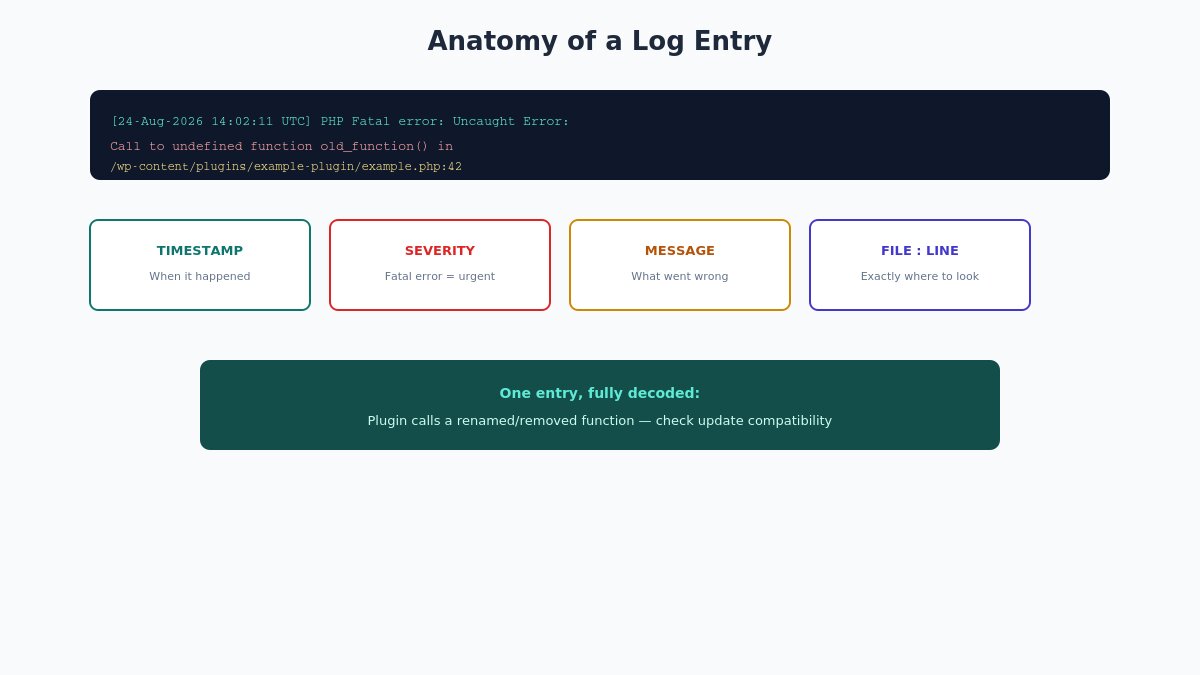
A typical log entry follows a consistent structure, and once you can parse the pattern, every future entry becomes readable the same way:
[dd-Mon-yyyy hh:mm:ss UTC] PHP Fatal error: Uncaught Error:
Call to undefined function old_function() in
/home/site/public_html/wp-content/plugins/example-plugin/example.php:42
Breaking this down piece by piece:
Timestamp — when the error occurred, useful for correlating with when you noticed the problem or made a recent change.
Severity level — “Fatal error” here, covered in detail below, tells you how serious this specific entry actually is.
The error type and message — “Uncaught Error: Call to undefined function” describes specifically what went wrong.
File path — the exact file where the problem occurred, immediately telling you whether it’s a theme, a plugin, a Joomla extension, or core code.
Line number — the specific line inside that file, letting you (or a developer) go directly to the problem instead of reading the entire file.
This single entry alone tells you: something tried to call a function called old_function() that doesn’t exist, inside a specific plugin’s example.php file, at line 42 — almost certainly because the plugin was updated and that function was renamed or removed, while something else (another plugin, or leftover custom code) is still trying to call the old name.
Severity Levels: Which Ones Actually Matter
PHP error severity levels explained
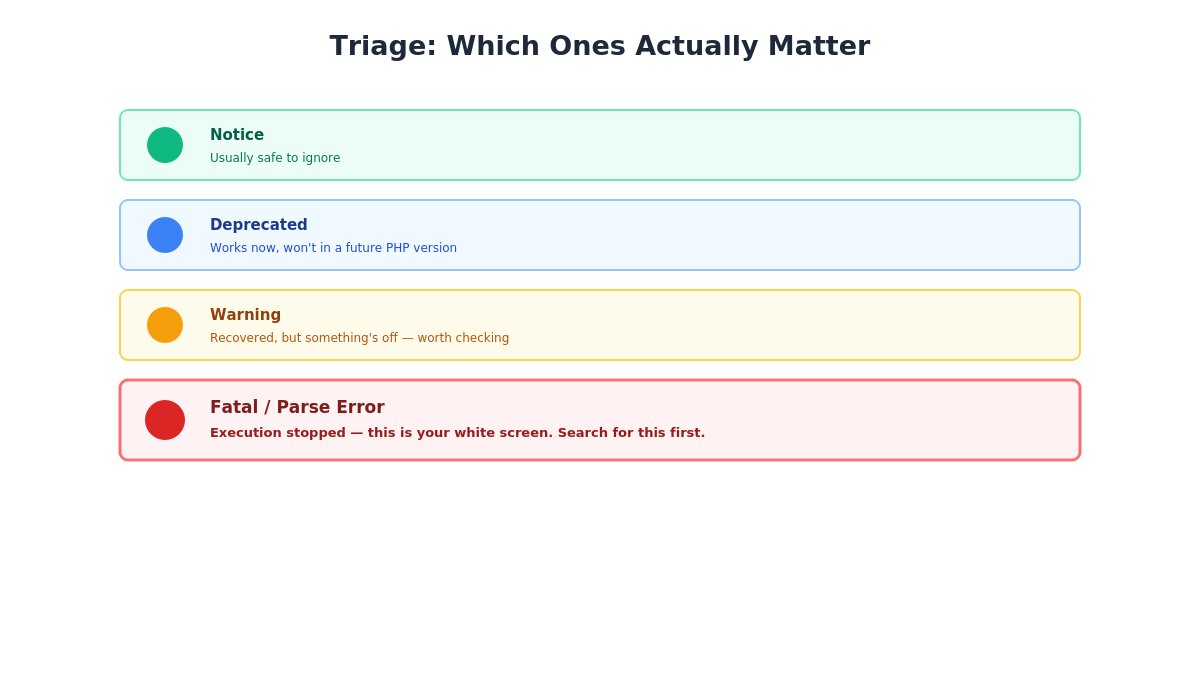
Not every log entry represents an actual problem, and treating them all with equal urgency wastes time. In roughly increasing order of how much attention they deserve:
Notice — the mildest level, often just PHP flagging something technically imperfect (like referencing a variable that hasn’t been explicitly set yet) that doesn’t actually break anything. Usually safe to ignore unless you’re specifically cleaning up code quality.
Deprecated — a function or feature still works today but is scheduled for removal in a future PHP version. Worth noting, particularly if you see many of these from the same plugin or theme, since it signals that code hasn’t been actively maintained for current PHP versions.
Warning — something went wrong, but PHP could recover and kept running. The page likely still loaded, possibly with something visually or functionally off. Worth investigating, not necessarily an emergency.
Fatal error / Parse error — execution stopped completely. This is almost always what’s actually behind a white screen or a “critical error” message, and it’s the entry worth searching for first when troubleshooting an actual outage.
When scanning a log for the first time during an active problem, search specifically for “Fatal” or “Parse error” rather than reading every single line chronologically — this gets you to the actual cause far faster than reading notices and warnings that aren’t related to what’s currently broken.
Turning On Detailed Logging (It’s Often Off by Default)
How to enable detailed error logging on WordPress and Joomla
Many hosting environments suppress detailed error display by default, for good reason — showing raw errors to site visitors is a security and professionalism problem. This means you often need to deliberately enable logging before useful detail actually gets captured.
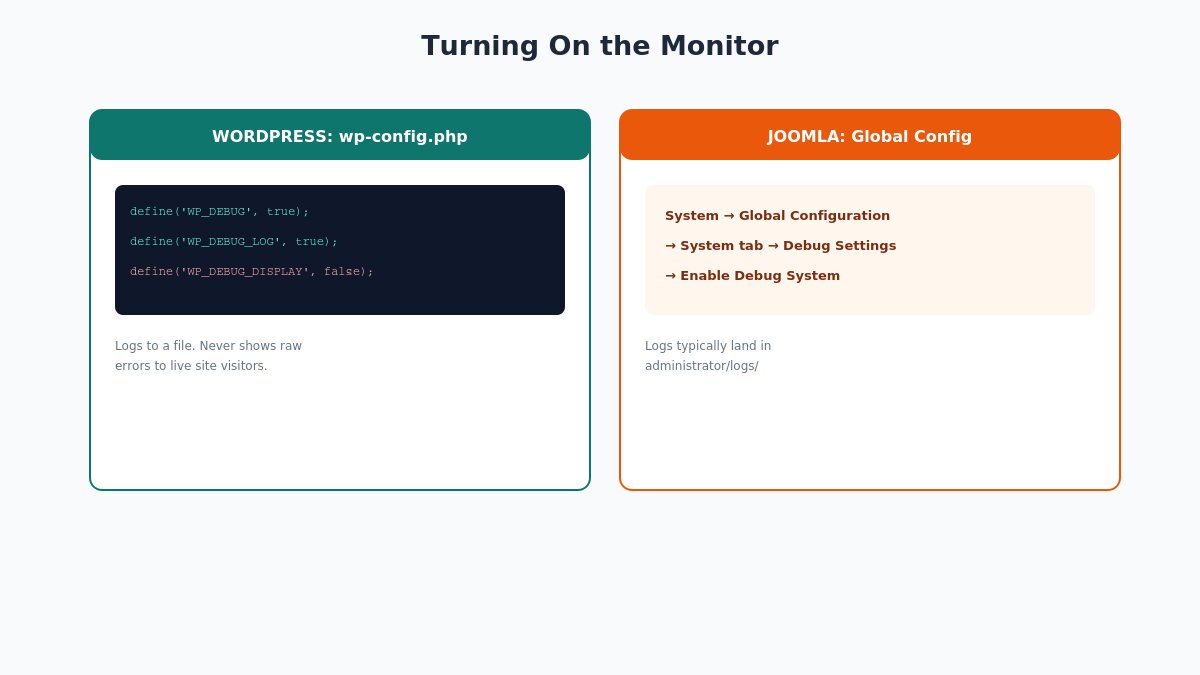
On WordPress, edit wp-config.php and add or adjust these lines:
This combination logs errors to a file (wp-content/debug.log) without displaying them on the live page to visitors — the correct balance for a production site. Setting WP_DEBUG_DISPLAY to true shows errors directly on the page, which is useful briefly while actively debugging on a staging site, but should never be left on for a live production site visitors actually see.
On Joomla, go to System → Global Configuration → System tab, and under Debug Settings, enable Debug System and Debug Language if relevant, then check the Logging section for where log files are being written — typically the administrator/logs/ folder unless configured otherwise.
Remember to turn detailed display logging back off once you’ve found what you needed — leaving verbose debug output enabled indefinitely on a live site is worth avoiding beyond the specific window where you’re actively troubleshooting.
Joomla Has More Than One Log to Check
Different types of Joomla log files to check
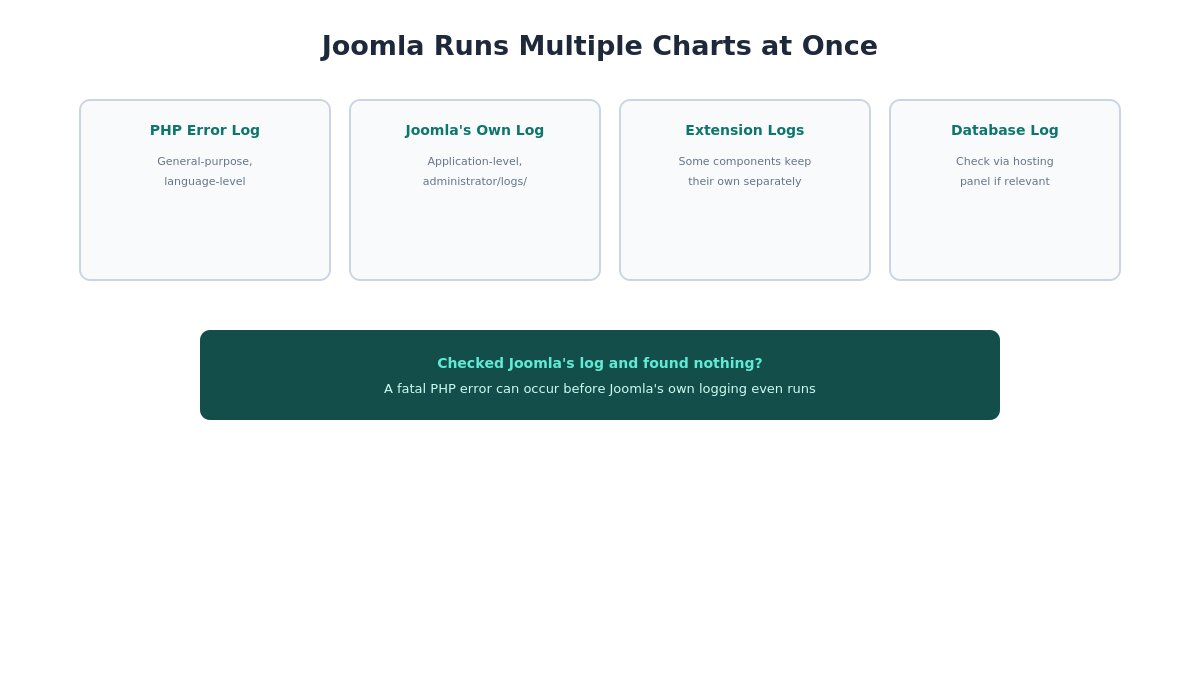
Worth knowing specifically for Joomla site owners: unlike WordPress’s single debug log, Joomla maintains several distinct log files for different purposes, and checking only one can mean missing the actual answer:
PHP error log — the same general-purpose log covered throughout this guide, capturing fatal errors, warnings, and notices at the PHP language level, regardless of which CMS is running.
Joomla’s own error log — separate from the raw PHP log, this captures Joomla-specific application errors and warnings at a higher level, typically written to administrator/logs/error.php or a similarly named file.
Extension-specific logs — some larger Joomla extensions (particularly e-commerce components, form builders, and security extensions) maintain their own separate logging, worth checking directly in the extension’s own settings if a problem seems isolated to that specific feature rather than the site broadly.
The database error log, if you’re troubleshooting something that looks database-related specifically — slow queries, connection failures — which may need to be checked through your hosting control panel rather than through Joomla’s own interface at all.
If you’ve checked Joomla’s own error log and it doesn’t show anything relevant to your specific problem, don’t assume the issue isn’t being logged anywhere — check the PHP-level log as well, since a fatal error at the PHP level can occur before Joomla’s own logging system even has a chance to record anything about it.
Reading Multiple Entries Together, Not Just One
A single isolated log entry is useful, but a real troubleshooting session often benefits from reading several consecutive entries as a sequence rather than examining just the first fatal error you find in isolation. A fatal error is sometimes the last in a chain — preceded by a series of warnings or notices from the same file, in the moments leading up to the actual failure, that together tell a more complete story than any single line does alone.
For example, several “Warning: Undefined array key” notices from the same plugin file, immediately followed by a “Fatal error: Uncaught TypeError” in that same file a few lines later in the log, often indicates the plugin was already handling some unexpected data poorly (the warnings) before it eventually hit a case it couldn’t recover from at all (the fatal error). Understanding this sequence can point toward a root cause — a specific piece of malformed data, a particular plugin setting, a specific type of content on the site — that reading only the final fatal error line wouldn’t reveal on its own.
When you find a relevant fatal error, it’s worth scrolling up a few entries in the log to see what happened immediately before it, particularly if the fatal error’s own message doesn’t fully explain why the underlying condition occurred in the first place.
A Worked Example: Diagnosing a Real Fatal Error
Worked example of diagnosing a fatal error from a log entry
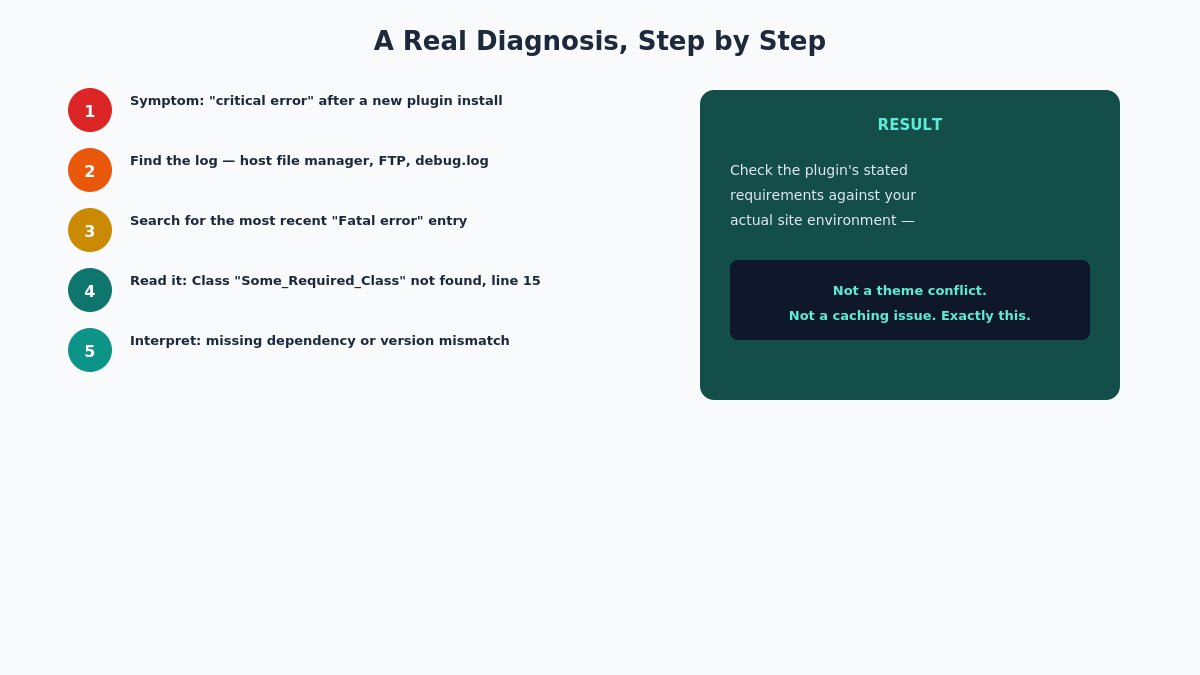
Rather than staying abstract, here’s a realistic troubleshooting sequence using an actual log entry:
Rather than staying abstract, here’s a realistic troubleshooting sequence using an actual log entry:
The symptom: your site shows “There has been a critical error on this website” after installing a new plugin.
Find the log — via your host’s file manager, FTP, or wp-content/debug.log if you’ve enabled logging as above.
Search for the most recent “Fatal error” entry, since that’s almost certainly today’s problem, not an old unrelated one further up the file.
Read the entry: PHP Fatal error: Uncaught Error: Class "Some_Required_Class" not found in /wp-content/plugins/new-plugin/init.php:15
Interpret it: the new plugin’s init.php file, at line 15, is trying to use a class that doesn’t exist — commonly because the plugin requires a specific PHP version, another plugin as a dependency, or a specific WordPress version the site doesn’t currently meet.
Act on it: check the plugin’s stated requirements against your actual site environment, rather than guessing at unrelated causes like a theme conflict or a caching issue that the log entry doesn’t actually point to at all.
This same sequence — find the log, isolate the most recent fatal entry, read the file path and message, and act on exactly what it says — applies to the overwhelming majority of “my site suddenly broke” situations on both platforms.
Common Error Patterns and What They Usually Mean
“Call to undefined function/method” — something is calling code that doesn’t exist, almost always from a version mismatch (a plugin update removed something another piece of code still expects) or an incomplete update.
“Allowed memory size exhausted” — the site hit PHP’s memory limit. This can mean a genuine memory leak in a plugin, or simply a memory limit set too low for what your site actually needs — check with your host about raising the memory_limit value.
“Class not found” — similar to the undefined function case, usually a missing dependency or a plugin/extension expecting something (another plugin, a specific PHP extension) that isn’t actually present.
Syntax or Parse error, often referencing a specific line — almost always a manually edited file with a typo, most commonly from directly editing a theme or template file rather than using a child theme or override (a mistake worth avoiding for reasons beyond just this one).
Managing Log File Size Over Time
Managing PHP error log file size over time
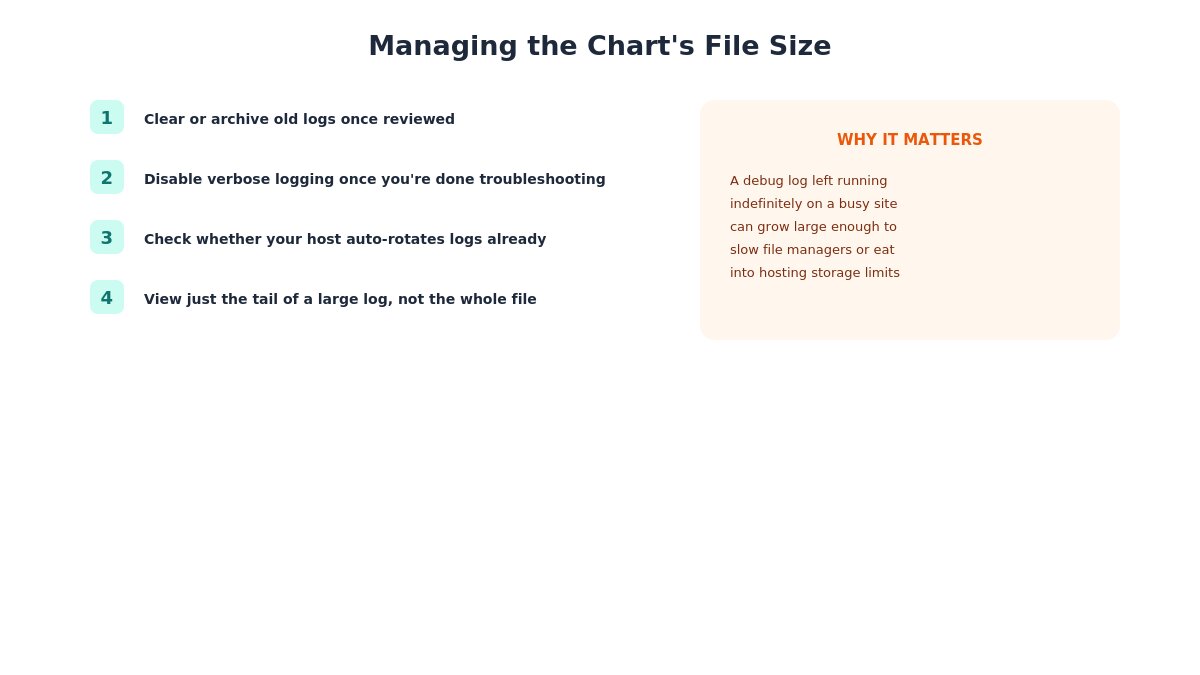
A detail that catches people off guard once they start actively using error logs: a debug log left enabled indefinitely on a busy site, or one that’s quietly accumulating notices and warnings from a chatty plugin, can grow to a genuinely large file size over weeks or months — sometimes large enough to cause its own problems, like slow file manager loading or, in extreme cases, contributing to hosting storage limits.
A few practical habits worth adopting once you’re actively using logging as an ongoing troubleshooting tool rather than a one-time emergency check:
Periodically clear or archive old log files once you’ve reviewed and addressed what’s relevant, rather than letting a single log file grow indefinitely.
Disable WP_DEBUG_LOG (or Joomla’s equivalent) once you’re done actively troubleshooting, rather than leaving verbose logging running permanently on a site where you’re not currently investigating anything specific.
Check whether your hosting provider automatically rotates and archives logs — many do, which handles this concern for you automatically, but it’s worth confirming rather than assuming.
If a log file has become large enough to be unwieldy to open directly, most hosting file managers or command-line tools can show just the last portion of the file (the most recent entries), which is usually what you actually need rather than the entire history.
Sharing a Log Safely When Asking for Help
How to safely share error log excerpts when asking for support help
If you’ve found a relevant error but need help from a developer, your host’s support team, or a plugin’s own support channel, how you share the log matters:
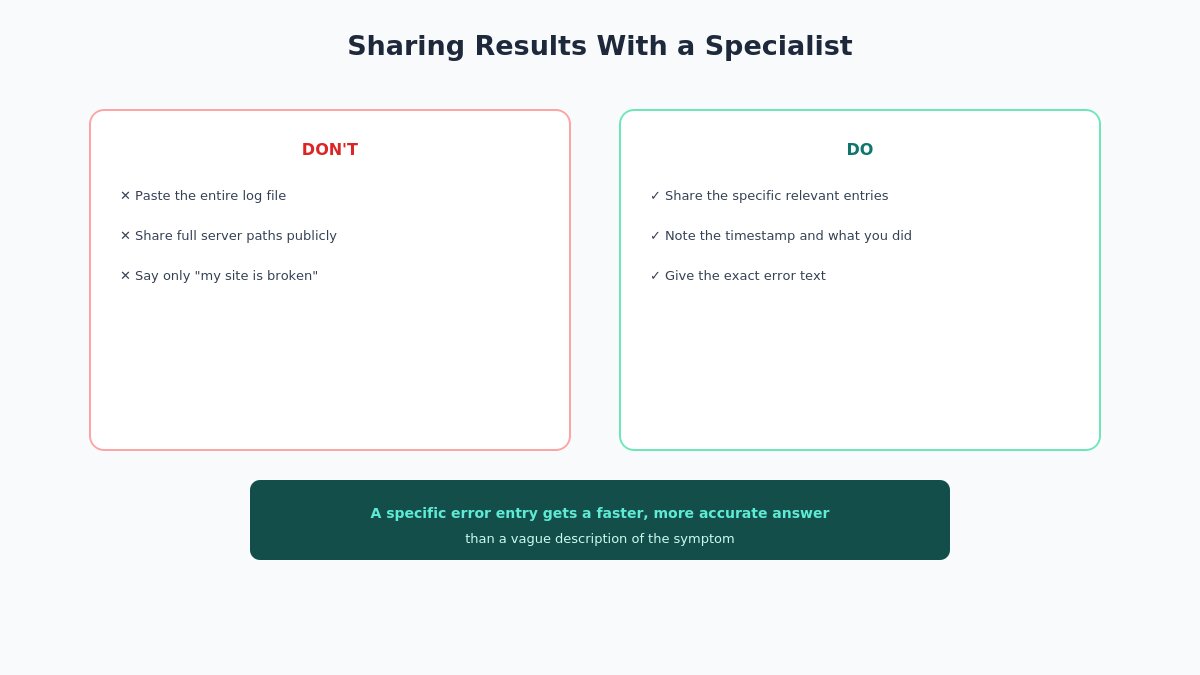
Share the specific relevant entries, not the entire log file, particularly for a log that’s grown large — a support person wants the fatal error and a few lines of surrounding context, not hundreds of unrelated notices to scroll through.
Redact or generalize any information that reveals more than necessary about your server’s file structure or configuration if you’re posting in a public forum rather than a private support ticket, since full server file paths occasionally reveal more about your hosting setup than you’d want publicly visible.
Include the timestamp and a brief note on what you were doing when the error occurred (installing a plugin, saving a specific page, nothing in particular), since this context often narrows down the cause faster than the raw error text alone.
If you’re sharing this with our ticket support team, the same principle applies — the specific error entry plus a brief description of what triggered it gets you a faster, more accurate answer than “my site is broken, please help.”
Where to Actually Find the Log File
If WP_DEBUG_LOG or Joomla’s logging path doesn’t immediately turn up a file where you expect it, a few places to check: your hosting control panel (cPanel and similar panels often have a dedicated “Error Log” viewer separate from your CMS’s own logging); the server’s root-level PHP error log, commonly configured by your host rather than your CMS; or directly via FTP, checking the wp-content/ folder for WordPress or the configured logging path for Joomla. If you’re not sure where your specific hosting setup writes logs, your host’s support team can point you directly to it — this is a completely standard request they field constantly.
If digging through logs and diagnosing the actual cause isn’t something you want to take on yourself, our custom work team can trace a specific error back to its source, and our documentation covers platform-specific notes for anyone running one of our templates.
The Habit That Turns Guessing Into Diagnosis
The single habit worth building is this: the moment something breaks, check the log before trying anything else — before deactivating random plugins, before restoring an old backup, before assuming it’s whatever you changed most recently. The log usually tells you exactly what broke and where, in the time it takes to open one file and search for the word “Fatal.” Everything else in troubleshooting gets faster once you’re working from a specific, confirmed cause instead of a guess.
That shift — from reacting to a vague symptom to diagnosing a specific, named cause — is really the whole value of learning to read these logs in the first place. The format never changes, the severity levels never change, and the same reading skill applies identically whether you’re troubleshooting a WordPress plugin conflict today or a Joomla extension issue five years from now.
Want a theme built on clean, well-documented code that keeps your error logs quiet? Browse our WordPress themes or Joomla templates.
We're a Digital Team from EngineTemplate with 5 content experts. Our team has 5 years exp in open source Joomla and WordPress, we make daily blogs and build useful resources for everyone who is having issues with open source while using it.
 ET Digital Team